Chapter 4. Compiling and Building
Red Hat Enterprise Linux 6 includes many packages used for software
development, inluding tools for compiling and building source code. This
chapter discusses several of these packages and tools used to compile
source code.
4.1. GNU Compiler Collection (GCC)
The GNU Compiler Collection (GCC) is a set of tools for compiling a
variety of programming languages (including C, C++,
ObjectiveC,ObjectiveC++, Fortran, and Ada) into highly optimized machine
code. These tools include various compilers (like gcc and g++), run-time libraries (like libgcc, libstdc++, libgfortran, and libgomp), and miscellaneous other utilities.
4.1.1. GCC Status and Features
GCC for Red Hat Enterprise Linux 6 is based on the 4.4.x release
series and includes several bug fixes, enhancements, and backports from
upcoming releases (including the GCC 4.5). However, GCC 4.5 was not
considered sufficiently mature for an enterprise distribution when
RHEL6 features were frozen.
This standardization means that as updates to the 4.4 series become
available (4.4.1, 4.4.2, ect), they will be incorporated into the
compiler included with RHEL6 as updates. Red Hat may import additional
backports and enhancements from upcoming releases outside the 4.4 series
that won't break compatibility within the Enterprise Linux release.
Occassionally, code that was not compliant to standards may fail to
compile or its functionality may change in the process of fixing bugs or
maintaining standards compliant behavior.
Since the previous release of Red Hat Enterprise Linux, GCC has had
three major releases: 4.2.x, 4.3.x, and 4.4.x. A selective summary of
the expansive list of changes follows.
The inliner, dead code elimination routines, compile time, and
memory usage codes are now improved. This release also features a new
register allocator, instruction scheduler, and software pipeliner.
Version 3.0 of the OpenMP specification is now supported for the C, C++, and Fortran compilers.
Experimental support for the upcoming ISO C++ standard (C++0x) is
included. This has support for auto/inline namespaces, character types,
and scoped enumerations. To enable this, use the compiler options -std=c++0x (which disables GNU extensions) or -std=gnu++0x.
For a more detailed list of the status of C++0x improvements, refer to:
GCC now incorporates the
Variable Tracking at Assignments
(VTA) infrastructure. This allows GCC to better track variables during
optimizations so that it can produce improved debugging information
(i.e. DWARF) for the Gnome Debugger, SystemTap, and other tools. For a
brief overview of VTA, refer to
Section 5.3, “Variable Tracking at Assignments”.
With VTA you can debug optimized code drastically better than with
previous GCC releases, and you do not have to compile with -O0 to
provide a better debugging experience.
Fortran 2008 is now supported, while support for Fortran 2003 is extended.
For a more detailed list of improvements in GCC, refer to:
In addition to the changes introduced via the GCC 4.4 rebase, the Red
Hat Enterprise Linux 6 version of GCC also features several fixes and
enhancements backported from upstream sources (i.e. version 4.5 and
beyond). These improvements include the following (among others):
Improved DWARF3 debugging for debugging optimized C++ code.
Fortran optimization improvements.
More accurate instruction length information for ix86, Intel 64 and AMD64, and s390.
Intel Atom support
POWER7 support
C++ raw string support, u/U/u8 string literal support
4.1.2. Language Compatibility
Application Binary Interfaces specified by the GNU C, C++, Fortran and Java Compiler include:
Calling conventions. These specify how arguments are passed to functions and how results are returned from functions.
Register usage conventions. These specify how processor registers are allocated and used.
Object file formats. These specify the representation of binary object code.
Size, layout, and alignment of data types. These specify how data is laid out in memory.
Interfaces provided by the runtime environment. Where the
documented semantics do not change from one version to another they must
be kept available and use the same name at all times.
The default system C compiler included with Red Hat Enterprise
Linux 6 is largely compatible with the C99 ABI standard. Deviations
from the C99 standard in GCC 4.4 are tracked
online.
In addition to the C ABI, the Application Binary Interface for
the GNU C++ Compiler specifies the binary interfaces needed to support
the C++ language, such as:
Name mangling and demangling
Creation and propagation of exceptions
Formatting of run-time type information
Constructors and destructors
Layout, alignment, and padding of classes and derived classes
Virtual function implementation details, such as the layout and alignment of virtual tables
The default system C++ compiler included with Red Hat Enterprise Linux 6 conforms to the C++ ABI defined by the
Itanium C++ ABI (1.86).
Although every effort has been made to keep each version of GCC
compatibile with previous releases, some incompatibilities do exist.
The following is a list of known incompatibilities between the Red Hat Enterprise Linux 6 and 5 toolchains.
Passing/returning structs with flexible array members by value changed in some cases on Intel 64 and AMD64.
Passing/returning of unions with long double members by value changed in some cases on Intel 64 and AMD64.
Passing/returning structs with complex float member by value changed in some cases on Intel 64 and AMD64.
Passing of 256-bit vectors on x86, Intel 64 and AMD64 platforms changed when -mavx is used.
There have been multiple changes in passing of _Decimal{32,64,128}
types and aggregates containing those by value on several targets.
Packing of packed char bitfields changed in some cases.
The following is a list of known incompatibilities between the Red Hat Enterprise Linux 5 and 4 toolchains.
There have been changes in the library interface specified by the
C++ ABI for thread-safe initialization of function-scope static
variables.
On Intel 64 and AMD64, the medium model for building
applications where data segment exceeds 4GB, was redesigned to match the
latest ABI draft at the time. The ABI change results in incompatibility
among medium model objects.
The compiler flag -Wabi can be used to
get diagnostics indicating where these constructs appear in source code,
though it will not catch every single case. This flag is especially
useful for C++ code to warn whenever the compiler generates code that is
known to be incompatible with the vendor-neutral C++ ABI.
Excluding the incompatibilities listed above, the GCC C and C++ language ABIs are mostly ABI compatible. The vast majority of source code will not encounter any of the known issues, and can be considered compatible.
Compatible ABIs allow the objects created by compiling source code to
be portable to other systems. In particular, for Red Hat Enterprise
Linux, this allows for upward
compatibility. Upward compatibility is defined as the ability to link
shared libraries and objects, created using a version of the compilers
in a particular RHEL release, with no problems. This includes new
objects compiled on subsequent RHEL releases.
The C ABI is considered to be stable, and has been so since at least
RHEL3 (again, barring any incompatibilities mentioned in the above
lists). Libraries built on RHEL3 and later can be linked to objects
created on a subsequent environment (RHEL4, RHEL5, and RHEL6).
The C++ ABI is considered to be stable, but less stable than the C
ABI, and only as of RHEL4 (corresponding to GCC version 3.4 and above.).
As with C, this is only an upward compatibility. Libraries built on
RHEL4 and above can be linked to objects created on a subsequent
environment (RHEL5, and RHEL6).
To force GCC to generate code compatible with the C++ ABI in RHEL releases prior to RHEL4, some developers have used the -fabi-version=1
option. This practice is not recommended. Objects created this way are
indistinguishable from objects conforming to the current stable ABI, and
can be linked (incorrectly) amongst the different ABIs, especially when
using new compilers to generate code to be linked with old libraries
that were built with tools prior to RHEL4.
The above incompatibilities make it incredibly difficult to maintain
ABI shared library sanity between releases, especially if when
developing custom libraries with multiple dependencies outside of the
core libraries. Therefore, if shared libraries are developed, it is highly recommend that a new version is built for each Red Hat Enterprise Linux release.
4.1.3. Object Compatibility and Interoperability
Two items that are important are the changes and enhancements in the
underlying tools used by the compiler, and the compatibility between the
different versions of a language's compiler.
Changes and new features in tools like ld (distributed as part of the binutils package) or in the dynamic loader (ld.so, distributed as part of the glibc
package) can subtly change the object files that the compiler produces.
These changes mean that object files moving to the current release of
Red Hat Enterprise Linux from previous releases may loose functionality,
behave differently at runtime, or otherwise interoperate in a
diminished capacity. Known problem areas include:
ld --build-id
In RHEL6 this is passed to ld by default, whereas RHEL5 ld doesn't recognize it.
as .cfi_sections support
In RHEL6 this directive allows .debug_frame, .eh_frame or both to be emitted from .cfi* directives. In RHEL5 only .eh_frame is emitted.
as, ld, ld.so, and gdb STB_GNU_UNIQUE and %gnu_unique_symbol support
In RHEL6 more debug information is generated and stored in object
files. This information relies on new features detailed in the DWARF standard, and also on new extensions not yet standardized. In RHEL5, tools like as, ld, gdb, objdump, and readelf
may not be prepared for this new information and may fail to
interoperate with objects created with the newer tools. In addition,
RHEL5 produced object files do not support these new features; these
object files may be handled by RHEL6 tools in a sub-optimal manner.
An outgrowth of this enhanced debug information is that the
debuginfo packages that ship with system libraries allow you to do
useful source level debugging into system libraries if they are
installed. Refer to
Section 5.1, “Installing Debuginfo Packages” for more information on debuginfo packages.
Object file changes, such as the ones listed above, may interfere with the portable use of prelink.
4.1.4. Backwards Compatibility Packages
Several packages are provided to serve as an aid for those moving
source code or executables from older versions of Red Hat Enterprise
Linux to the current release. These packages are intended to be used as a
temporary aid in transitioning sources to newer compilers with changed
behavior, or as a convenient way to otherwise isolate differences in the
system environment from the compile environment.
Please be advised that Red Hat may remove these packages in future Red Hat Enterprise Linux releases.
The following packages provide compatibility tools for compiling
Fortran or C++ source code on the current release of Red Hat Enterprise
Linux 6 as if one was using the older compilers on Red Hat Enterprise Linux 4:
compat-gcc-34
compat-gcc-34-c++
compat-gcc-34-g77
The following package provides a compatibility runtime library for Fortran exectuables compiled on Red Hat Enterprise Linux 5 to run without recompilation on the current release of Red Hat Enterprise Linux 6:
Please note that backwards compatibility library packages are not
provided for all supported system libraries, just the system libraries
pertaining to the compiler and the C/C++ standard libraries.
For more information about backwards compatibility library packages, refer to the Application Compatibility section of the Red Hat Enterprise Linux 6 Migration Guide.
4.1.5. Previewing RHEL6 compiler features on RHEL5
On Red Hat Enterprise Linux 5, we have included the package gcc44
as an update. This is a backport of the RHEL6 compiler to allow users
running RHEL5 to compile their code with the RHEL6 compiler and
experiment with new features and optimizations before upgrading their
systems to the next major release. The resulting binary will be forward
compatible with RHEL6, so one can compile on RHEL5 with gcc44 and run on RHEL5, RHEL6, and above.
The RHEL5 gcc44 compiler will be kept
reasonably in step with the GCC 4.4.x that we ship with RHEL6 to
ease transition. Though, to get the latest features, it is recommended
RHEL6 is used for development. The gcc44 is only provided as an aid in the conversion process.
To compile using GCC tools, first install binutils and gcc; doing so will also install several dependencies.
In brief, the tools work via the gcc
command. This is the main driver for the compiler. It can be used from
the command line to pre-process or compile a source file, link object
files and libraries, or perform a combination thereof. By default, gcc takes care of the details and links in the provided libgcc library.
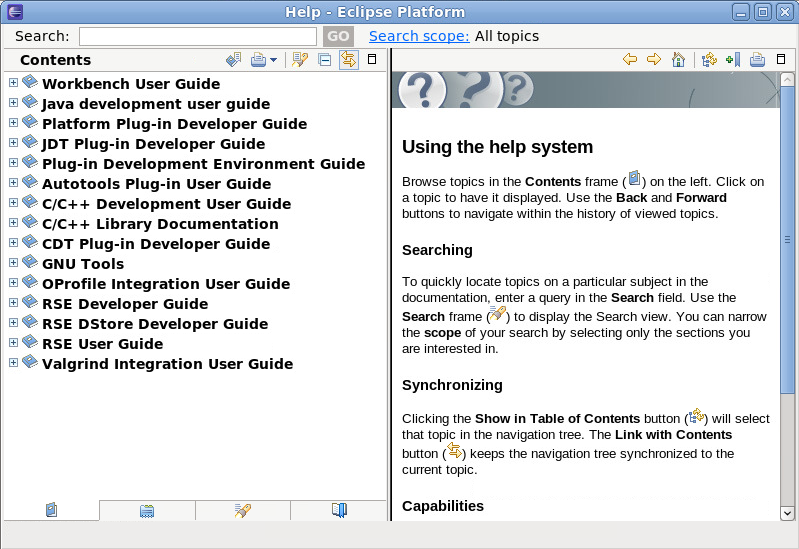
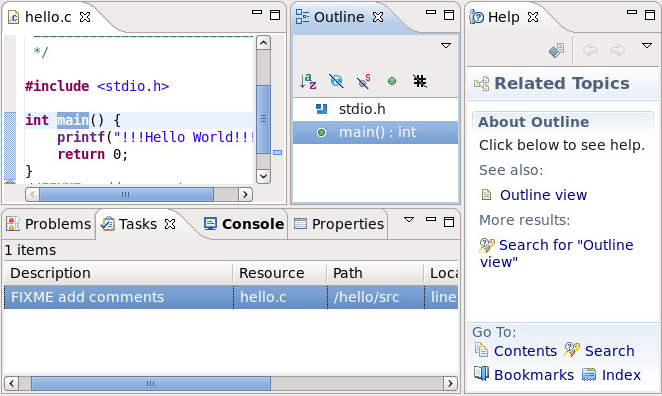
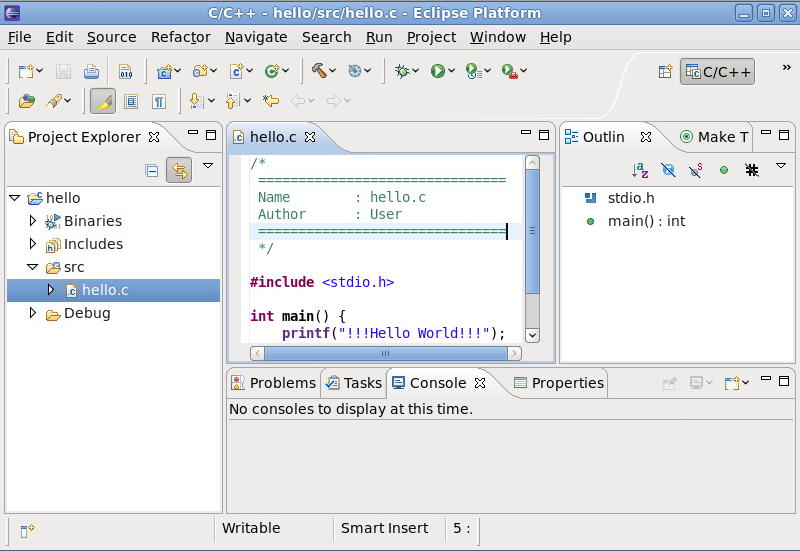
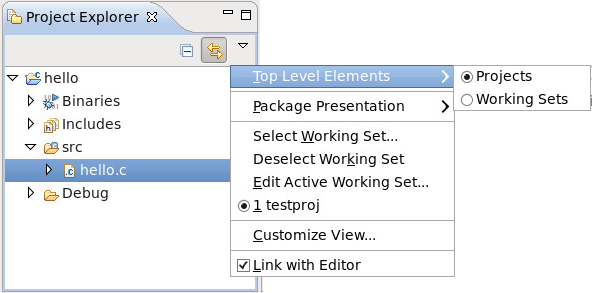
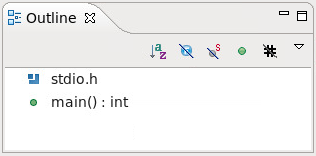
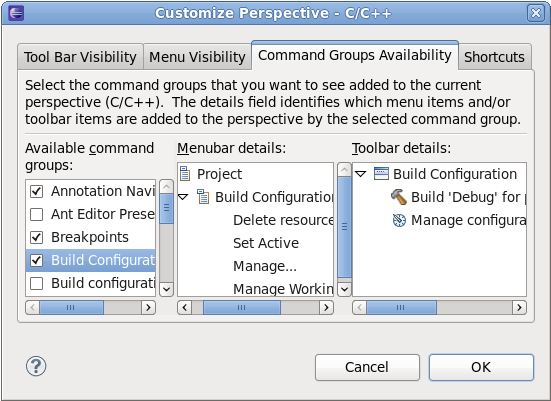
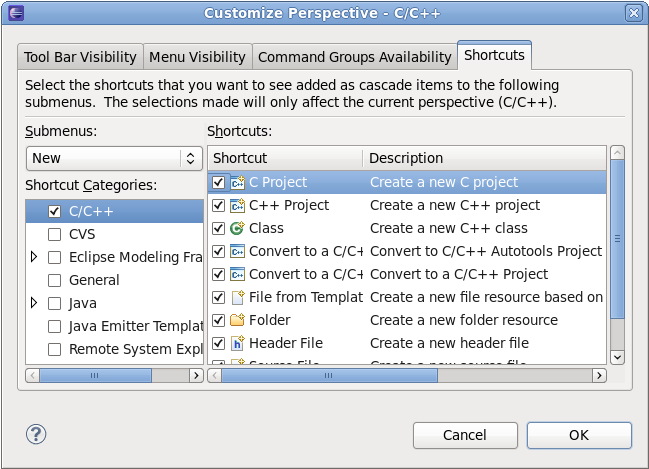
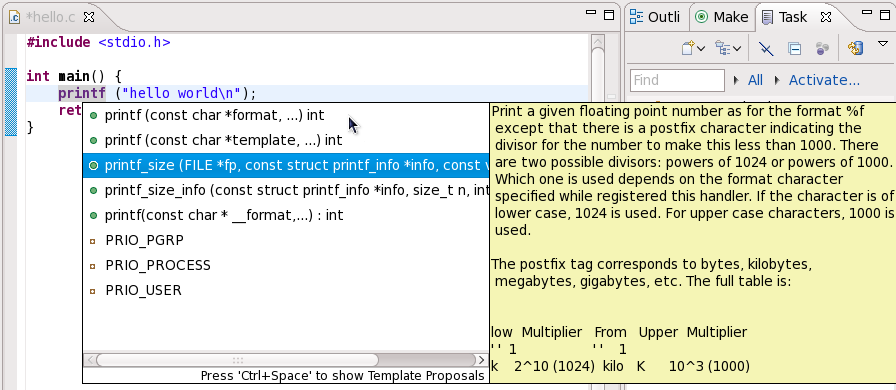
The compiler functions provided by GCC are also integrated into the Eclipse IDE as part of the
CDT.
This presents many advantages, particularly for developers who prefer a
graphical interface and fully integrated environment. For more
information about compiling in Eclipse, refer to
Section 1.3, “
Development Toolkits”.
Conversely, using GCC tools from the command-line interface consumes
less system resources. This also allows finer-grained control over
compilers; GCC's command-line tools can even be used outside of the
graphical mode (runlevel 5).
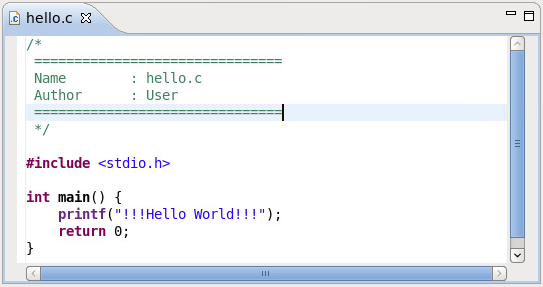
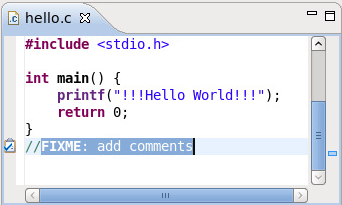
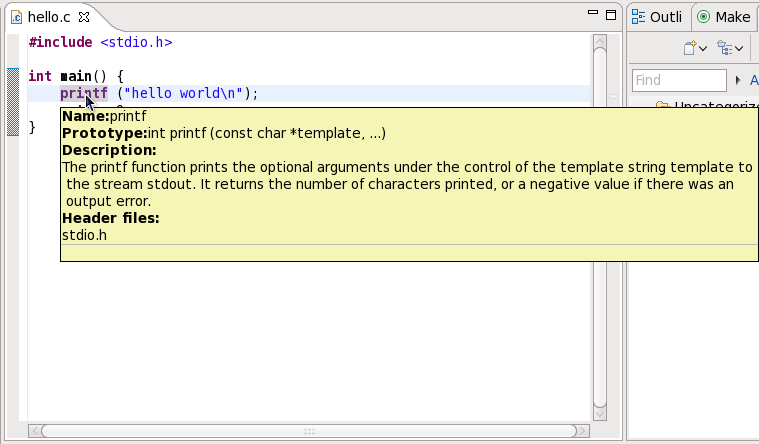
Basic compilation of a C language program using GCC is easy. Start with the following simple program:
The following procedure illustrates the compilation process for C in its most basic form.
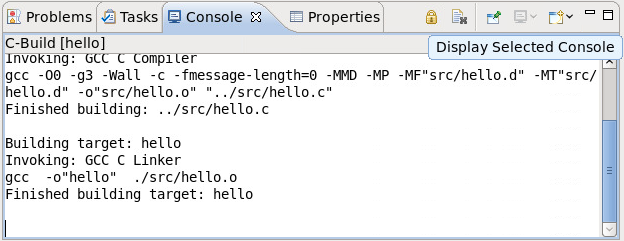
Procedure 4.1. Compiling a 'Hello World' C Program
Compile
hello.c into an executable with:
gcc hello.c -o hello
Ensure that the resulting binary hello is in the same directory as hello.c.
Run the hello binary, i.e. hello.
4.1.6.2. Simple C++ Usage
Basic compilation of a C++ language program using GCC is similar. Start with the following simple program:
The following procedure illustrates the compilation process for C++ in its most basic form.
Procedure 4.2. Compiling a 'Hello World' C++ Program
Compile
hello.cc into an executable with:
g++ hello.cc -o hello
Ensure that the resulting binary hello is in the same directory as hello.cc.
Run the hello binary, i.e. hello.
4.1.6.3. Simple Multi-File Usage
To use basic compilation involving multiple files or object files, start with the following two source files:
The following procedure illustrates a simple, multi-file compilation process in its most basic form.
Procedure 4.3. Compiling a Program with Muiltiple Source Files
Compile
one.c into an executable with:
gcc -c one.c -o one.o
Ensure that the resulting binary one.o is in the same directory as one.c.
Compile
two.c into an executable with:
gcc -c two.c -o two.o
Ensure that the resulting binary two.o is in the same directory as two.c.
Compile the two object files one.o and two.o into a single executable with:
gcc one.o two.o -o hello
Ensure that the resulting binary hello is in the same directory as one.o and two.o.
Run the hello binary, i.e. hello.
4.1.6.4. Recommended Optimization Options
Different projects require different optimization options. There is
no one-size-fits-all approach when it comes to optimization, but here
are a few guidelines to keep in mind.
It is very important to chose the correct architecture for
instruction scheduling. By default GCC produces code is optimized for
the most common processors, but if the CPU on which your code will run
is known, the corresponding -mtune= option to optimize the instruction scheduling, and -march= option to optimize the instruction selection should be used.
The option -mtune= optimizes
instruction scheduling to fit your architecture by tuning everything
except the ABI and the available instruction set. This option will not
chose particular instructions, but instead will tune your program in
such a way that executing on a particular architecture will be
optimized. For example, if an Intel Core2 CPU will predominantly be
used, choose -march=core2. If the wrong
choice is made, the program will still run, but not optimally on the
given architecture. The architecture on which the program will most
likely run should always be chosen.
The option -march= optimizes
instruction selection. As such, it is important to choose correctly as
choosing incorrectly will cause your program to fail. This option
selects the instruction set used when generating code. For example, if
the program will be run on an AMD K8 core based CPU, choose -march=k8. Specifying the architecture with this option will imply -mtune=.
The -mtune= and -march=
commands should only be used for tuning and selecting instructions
within a given architecture, not to generate code for a different
architecture (also known as cross-compiling). For example, this is not
to be used to generate PowerPC code from an Intel 64 and AMD64
platform.
The compiler flag -O2 is a good middle
of the road option to generate fast code. It produces the best
optimized code when the resulting code size is not large. Use this when
unsure what would best suit.
When code size is not an issue, -O3 is
preferrable. This option produces code that is slightly larger but runs
faster because of a more frequent inline of functions. This is ideal for
floating point intensive code.
The other general purpose optimization flag is -Os.
This flag also optimizes for size, and produces faster code in
situations where a smaller footprint will increase code locality,
thereby reducing cache misses.
Use -frecord-gcc-switches when
compiling objects. This records the options used to build objects into
objects themselves. After an object is built, it determines which set of
options were used to build it. The set of options are then recorded in a
section called .GCC.command.line within the object and can be examined with the following:
$ gcc -frecord-gcc-switches -O3 -Wall hello.c -o hello
$ readelf --string-dump=.GCC.command.line hello

String dump of section '.GCC.command.line':
  [     0]  hello.c
  [     8]  -mtune=generic
  [    17]  -O3
  [    1b]  -Wall
  [    21]  -frecord-gcc-switches
4.1.6.5. Using Profile Feedback to Tune Optimization Heuristics.
During the transformation of a typical set of source code into an
executable, tens of hundreds of choices must be made about the
importance of speed in one part of code over another, or code size as
opposed to code speed. By default, these choices are made by the
compiler using reasonable heuristics, tuned over time to produce the
optimum runtime performance. However, GCC also has a way to teach the
compiler to optimize executables for a specific machine in a specific
production environment. This feature is called profile feedback.
Profile feedback is used to tune optimizations such as:
Profile feedback compiles a program first to generate a program that
is run and analyzed and then a second time to optimize with the
gathered data.
Procedure 4.4. Using Profile Feedback
Step One
The application must be instrumented to produce profiling information by compiling it with -fprofile-generate.
Step Two
Run the application to accumulate and save the profiling information.
Step Three
Recompile the application with -fprofile-use.
Step three will use the profile information gathered in step one to
tune the compiler's heuristics while optimizing the code into a final
executable.
Procedure 4.5. Compiling a Program with Profiling Feedback
Compile source.c to include profiling instrumentation:
gcc source.c -fprofile-generate -O2 -o executable
Run executable to gather profiling information:
./executable
Recompile and optimize source.c with profiling information gathered in step one:
gcc source.c -fprofile-use -O2 -o executable
Multiple data collection runs, as seen in step two, will accumulate
data into the profiling file instead of replacing it. This allows the
executable in step two to be run multiple times with additional
representative data in order to collect even more information.
The executable must run with representative levels of both the
machine being used and a respective data set large enough for the input
needed. This ensures optimal results are achieved.
By default, GCC will generate the profile data into the directory
where step one was performed. To generate this information elsewhere,
compile with -fprofile-dir=DIR where DIR is the preferred output directory.
The format of the compiler feedback data file changes between
compiler versions. It is imperative that the program compilation is
repeated with every new version of the compiler.
4.1.6.6. Using 32-bit compilers on a 64-bit host
On a 64-bit host, GCC will build executables that can only run on
64-bit hosts. However, GCC can be used to build executables that will
run both on 64-bit hosts and on 32-bit hosts.
To build 32-bit binaries on a 64-bit host, first install 32-bit
versions of any supporting libraries the executable may need. This must
at least include supporting libraries for glibc and libgcc, and possibly for libstdc++ if the program is a C++ program. On Intel 64 and AMD64, this can be done with:
yum install glibc-devel.i686 libgcc.i686 libstdc++-devel.i686
There may be cases where it is useful to to install additional
32-bit libraries that a program may need. For example, if a program uses
the db4-devel libraries to build, the 32-bit version of these libraries can be installed with:
yum install db4-devel.i686
The .i686 suffix on the x86 platform (as opposed to x86-64) specifies a 32-bit version of the given package. For PowerPC architectures, the suffix is ppc (as opposed to ppc64).
After the 32-bit libraries have been installed, the -m32
option can be passed to the compiler and linker to produce 32-bit
executables. Provided the supporting 32-bit libraries are installed on
teh 64-bit system, this executable will be able to run on both 32-bit
systems and 64-bit systems.
Procedure 4.6. Compiling a 32-bit Program on a 64-bit Host
On a 64-bit system, compile hello.c into a 64-bit executable with:
gcc hello.c -o hello64
Ensure that the resulting executable is a 64-bit binary:
$ file hello64
hello64: ELF 64-bit LSB executable, x86-64, version 1 (GNU/Linux), dynamically linked (uses shared libs), for GNU/Linux 2.6.18, not stripped
$ ldd hello64
linux-vdso.so.1 =>  (0x00007fff242dd000)
libc.so.6 => /lib64/libc.so.6 (0x00007f0721514000)
/lib64/ld-linux-x86-64.so.2 (0x00007f0721893000)
The command file on a 64-bit executable will include ELF 64-bit in its output, and ldd will list /lib64/libc.so.6 as the main C library linked.
On a 64-bit system, compile hello.c into a 32-bit executable with:
gcc -m32 hello.c -o hello32
Ensure that the resulting executable is a 32-bit binary:
$ file hello32
hello32: ELF 32-bit LSB executable, Intel 80386, version 1 (GNU/Linux), dynamically linked (uses shared libs), for GNU/Linux 2.6.18, not stripped
$ ldd hello32
linux-gate.so.1 =>  (0x007eb000)
libc.so.6 => /lib/libc.so.6 (0x00b13000)
/lib/ld-linux.so.2 (0x00cd7000)
The command file on a 32-bit executable will include ELF 32-bit in its output, and ldd will list /lib/libc.so.6 as the main C library linked.
If you have not installed the 32-bit supporting libraries you will get an error similar to this for C code:
$ gcc -m32 hello32.c -o hello32
/usr/bin/ld: crt1.o: No such file: No such file or directory
collect2: ld returned 1 exit status
A similar error would be triggered on C++ code:
$ g++ -m32 hello32.cc -o hello32-c++
In file included from /usr/include/features.h:385,
     from /usr/lib/gcc/x86_64-redhat-linux/4.4.4/../../../../include/c++/4.4.4/x86_64-redhat-linux/32/bits/os_defines.h:39,
     from /usr/lib/gcc/x86_64-redhat-linux/4.4.4/../../../../include/c++/4.4.4/x86_64-redhat-linux/32/bits/c++config.h:243,
     from /usr/lib/gcc/x86_64-redhat-linux/4.4.4/../../../../include/c++/4.4.4/iostream:39,
     from hello32.cc:1:
/usr/include/gnu/stubs.h:7:27: error: gnu/stubs-32.h: No such file or directory
These errors indicate that the supporting 32-bit libraries have not
been properly installed as explained at the beginning of this section.
It is important to note that even if 32-bit binaries can run on
64-bit systems, it is preferrable to have 64-bit binaries unless
otherwise needed. In order to run 32-bit binaries on 64-bit systems, the
system must import additional 32-bit shared libraries that must be
loaded in tandem with the 64-bit libraries (for example glibc). This
causes additional memory usage on such systems. It is always preferrable
to have 64-bit binaries for 64-bit systems and 32-bit binaries for
32-bit systems.
Also important is to note that building with
-m32
will in not adapt or convert a program to resolve any issues arising
from 32/64-bit incompatibilities. For tips on writing portable code and
converting from 32-bits to 64-bits, see the paper entitled
Porting to 64-bit GNU/Linux Systems in the
Proceedings of the 2003 GCC Developers Summit.
For more information about GCC compilers, refer to the man pages for cpp, gcc, g++, gcj, and gfortran.
the following online user manuals are also available:
The main site for the development of GCC is
gcc.gnu.org.
GNU Autotools is a suite of command-line tools that allow developers
to build applications on different systems, regardless of the installed
packages or even Linux distribution. These tools aid developers in
creating a configure script. This script runs prior to builds and creates the top-level Makefiles needed to build the application. The configure
script may perform tests on the current system, create additional
files, or run other directives as per parameters provided by the
builder.
The Autotools suite's most commonly-used tools are:
- autoconf
Generates the configure script from an input file (e.g. configure.ac)
- automake
Creates the Makefile for a project on a specific system
- autoscan
Generates a preliminary input file (i.e. configure.scan), which can be edited to create a final configure.ac to be used by autoconf
All tools in the Autotools suite are part of the Development Tools group package. You can install this package group to install the entire Autotools suite, or simply use yum to install any tools in the suite as you wish.
4.4. Eclipse Built-in Specfile Editor
The Specfile Editor Plug-in for Eclipse provides useful features to help developers manage .spec files. This plug-in allows users to leverage several Eclipse GUI features in editing .spec files, such as auto-completion, highlighting, file hyperlinks, and folding.
In addition, the Specfile Editor Plug-in also integrates the rpmlint tool into the Eclipse interface. rpmlint
is a command-line tool that helps developers detect common RPM package
errors. The richer visualization offered by the Eclipse interface helps
developers quickly detect, view, and correct mistakes reported by rpmlint.
The Specfile Editor for Eclipse is provided by the eclipse-rpm-editor package. For more information about this plug-in, refer to Specfile Editor User Guide in the Eclipse .